I love these so I'm really sad to say this: What's missing is an AFR based on deployed time in increments, not total time.
For example: there should be a sliding window (or a histogram) relating to AFR after deployment for a time frame.
IE: AFR between 0-300 days, AFR between 301-600 days, AFR between 601-900 days (etc).
Otherwise we're looking at failures historically for the entire period, which might hide a spat of failures that consistently occur 3 years in, giving a relatively unfair advantage in numbers to newer drives.
That said, I really do love these and I hope they continue.
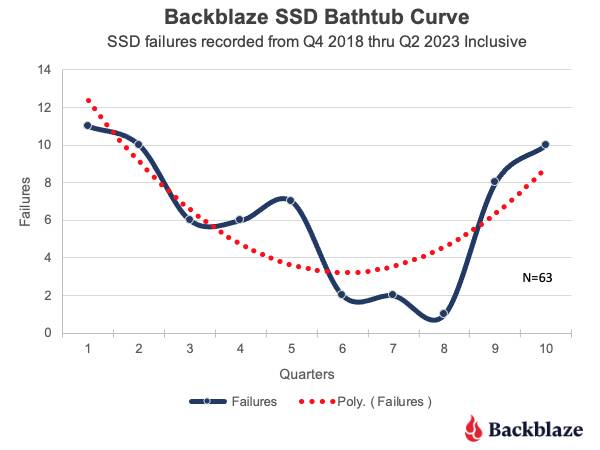
Backblaze's SSD bathtub curve shows higher failure rates < 6mo and > 3yr, with a sweet spot around 1.5yr where the failure rate is 4-5 times lower. -
https://regmedia.co.uk/2023/09/26/bathtub.jpg
For example: there should be a sliding window (or a histogram) relating to AFR after deployment for a time frame.
IE: AFR between 0-300 days, AFR between 301-600 days, AFR between 601-900 days (etc).
Otherwise we're looking at failures historically for the entire period, which might hide a spat of failures that consistently occur 3 years in, giving a relatively unfair advantage in numbers to newer drives.
That said, I really do love these and I hope they continue.